SMT生产线核心设备简介
一条完整的SMT生产线通常由以下几类关键设备构成,它们按照工艺流程依次排列:

(图片来源网络,侵删)
上板机 / 印刷机
- 功能:将空PCB板从料架或缓存区自动送入生产线,并精准地定位到锡膏印刷机的工作平台上。
- 关键点:确保PCB平稳、无偏移地进入下一道工序。
锡膏印刷机
- 功能:SMT的第一道关键工序,通过钢网将锡膏精确地印刷到PCB的焊盘上,为后续元器件的焊接提供焊料。
- 关键点:印刷精度、锡膏量控制、钢网清洁度。
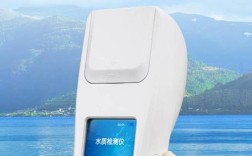
SPI (Solder Paste Inspector) - 锡膏检测仪
- 功能:在印刷锡膏后、贴片前,对锡膏的印刷质量进行检测,包括检查锡膏的体积、面积、高度、有无连锡、少锡等缺陷。
- 关键点:实现“过程控制”,在焊接前发现问题,避免后续返工。
贴片机
- 功能:SMT生产线的核心设备,它从供料器上拾取微型电子元器件,并通过视觉系统定位后,精确地放置到PCB的指定焊盘位置上。
- 分类:
- 高速贴片机:主要贴装小型、简单的元器件(如0201、0402电阻电容),追求的是“速度”。
- 高精度/多功能贴片机:主要贴装大型、异形、引脚密集的元器件(如BGA、QFP、连接器),追求的是“精度”和“多功能性”。
AOI (Automated Optical Inspection) - 自动光学检测仪
- 功能:在回流焊前或后,利用光学成像技术检查贴装后的PCB,查找元器件的缺失、偏移、立碑、错位、极性错误等缺陷。
- 关键点:质量控制的关键防线,分为焊前AOI和焊后AOI。
回流焊炉
- 功能:将贴好元器件的PCB送入一个经过精确控温的隧道式炉子,通过预热、浸润、回流、冷却四个阶段,使锡膏熔化并凝固,从而将元器件牢固地焊接在PCB上。
- 关键点:温区控制精度、热风均匀性,直接影响焊接质量。
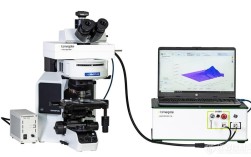
X-Ray检测仪
- 功能:主要用于检测BGA、CSP、LGA等隐藏焊点的焊接质量,它能穿透PCB板,看到焊点内部的情况,如连锡、空洞、虚焊等。
- 关键点:检测“看不见”的缺陷,是高端电子产品质量控制的重要手段。
下板机 / 传送设备
- 功能:将焊接完成并检测合格的PCB从生产线上自动卸下,送入下一道工序(如DIP插件波峰焊或测试包装)。
主流SMT设备品牌及代表型号
全球SMT设备市场由几家日本和欧洲巨头主导,它们在技术、精度和稳定性方面处于领先地位,中国本土品牌近年来也发展迅速,在性价比和市场响应速度上具有优势。
日本品牌
a) YAMAHA (雅马哈)
- 特点:全球SMT设备的领导者,技术全面,产品线覆盖高速贴片机、高精度贴片机、选择性波峰焊等,以其稳定性和可靠性著称。
- 代表型号:
- 高速贴片机:
- YSM系列:经典的高速机型号,如 YSM-24、YSM-47R 等,至今仍在许多工厂服役。
- YSM-X 系列:新一代高速机,速度和精度更高。
- 高精度/多功能贴片机:
- YV100X系列:旗舰级高精度机,专门用于贴装大型IC、连接器等,精度极高。
- YSM-L 系列:兼具速度和精度,适用于中高混合产线。
- 高速贴片机:
b) Panasonic (松下)
- 特点:与雅马哈齐名,同样是行业巨头,其高速贴片机在全球市场占有率极高,以超快的速度和稳定性闻名。
- 代表型号:
- 高速贴片机:
- NPM系列:绝对的高速王者,如 NPM-D3S、NPM-W2 等,贴装速度可以达到惊人的每小时数万片。
- 高精度/多功能贴片机:
- RM系列:如 RM1、RM2,用于贴装大型和异形元器件,性能卓越。
- 高速贴片机:
c) JUKI (日本东京重机)

(图片来源网络,侵删)
- 特点:在贴片机领域同样拥有极高的声誉,产品以稳定、耐用、性价比高著称,其KE系列高速机是全球应用最广泛的机型之一。
- 代表型号:
- 高速贴片机:
- KE系列:经典中的经典,如 KE-2070、KE-3020,结构成熟,故障率低,维护成本低。
- FX系列:新一代高速平台,性能更优。
- 高精度/多功能贴片机:
- RS系列:如 RS-1,专为高密度、高精度贴装设计。
- 高速贴片机:
d) Hitachi (日立)
- 特点:专注于高端市场,其高精度贴片机在半导体、汽车电子等要求苛刻的行业中备受推崇。
- 代表型号:
- 高精度贴片机:
- Siplace系列:日立收购原西门子子品牌后推出的产品,如 Siplace TX900,是处理超精细间距BGA和CSP的顶级设备。
- 高精度贴片机:
欧洲品牌
a) ASMPT (ASM Pacific Technology)
- 特点:由荷兰的ASMPT和德国的Siplace合并而成,是全球最大的SMT设备供应商之一,技术实力雄厚,产品线覆盖从印刷到检测的全流程。
- 代表型号:
- 高速贴片机:
- Siplace SX系列:如 SX500、SX800,是行业内的标杆产品,速度和精度都非常出色。
- 高精度贴片机:
- Siplace TX系列:如 TX900,顶级的高精度平台。
- 印刷机:
- DEK系列:全球顶级的锡膏印刷机品牌,如 DEK 268iXi,精度和稳定性极高。
- 高速贴片机:
中国大陆品牌
中国SMT设备品牌起步晚,但发展迅猛,凭借价格优势和快速的技术迭代,在国内及新兴市场占据了重要地位。
a) DEK (中科德科)

(图片来源网络,侵删)
- 特点:原为英国品牌,后被ASMPT收购,在中国有强大的生产和技术支持,其印刷机在中国市场占有率非常高。
- 代表型号:
- 印刷机:
- DEK Horizon系列:如 Horizon 03i / 05i,是新一代智能印刷机的代表,功能强大。
- 印刷机:
b) BEST (深圳市宇景高科技)
- 特点:国内知名的贴片机品牌,产品线从高速机到多功能机都有覆盖,性价比高,售后服务响应快。
- 代表型号:
- 高速贴片机:CP系列、E系列。
- 多功能贴片机:PR系列。
c) KME (深圳科迈电子)
- 特点:与BEST类似,是国产贴片机的重要力量,提供多种型号的贴片机,满足不同层次的需求。
- 代表型号:
- 高速贴片机:T系列。
- 多功能贴片机:M系列。
d) SMTONE (深圳创唯星)
- 特点:专注于中高端市场,其贴片机在精度和稳定性方面不断追赶国际品牌。
- 代表型号:
- 高速贴片机:Y系列。
- 多功能贴片机:X系列。
如何选择合适的SMT设备?
选择设备时,需要综合考虑以下因素:
-
产品类型:
- 消费电子:对速度要求高,可选用YAMAHA、Panasonic的高速机。
- 汽车电子/工业控制:对可靠性、精度要求极高,应优先选择YAMAHA、JUKI、ASMPT的高端机型。
- 小批量/多品种:需要多功能性好的设备,如YAMAHA的YV系列或JUKI的RS系列。
-
生产节拍:根据产量目标,计算所需贴片机的理论贴装速度,并留有余量。
-
预算:国际一线品牌价格昂贵,但性能和稳定性有保障,国产品牌价格更具优势,适合预算有限或对成本敏感的客户。
-
自动化与智能化:现代设备普遍具备远程监控、自动编程、AI视觉识别等功能,能大幅提升生产效率和良率。
-
售后服务与技术支持:设备是生产的核心,及时的技术支持和备件供应至关重要,选择在中国有强大服务网络的品牌非常重要。
希望这份详细的介绍能帮助您全面了解SMT机器及其品牌型号!